menuAllBtn
iPICHE iCloud Central
솔루션
iPICHE
Intelligent data center power management program

Do you know how much
electricity your data center uses?

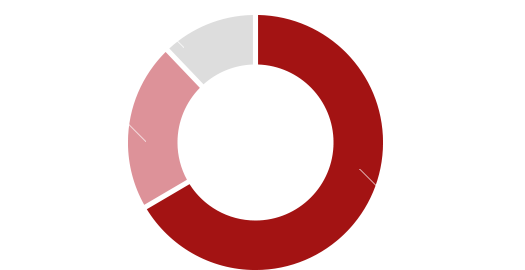
Of Company K's total electricity bill of 44,566,680 won,
approximately 70%, or 31,196,676 won, is used for computing.

Common features of computational
energy consumption

  • Absence of an integrated energy management system
  • Users don't turn off their devices
  • Below 30% of servers are unused (IDC)
  • There are many cases where the average server usage is 12% or less (IDC)
  • 24 × 7 × 365 energy consumption (wasted power)
  • Difficult for consumers to identify TOP energy
  • Difficult to measure and manage energy consumption

“Even now,
energy is being wasted!”

  • What are my company’s electricity usage and bill?
  • Is there any wasted energy?
  • What are effective energy saving methods?
  • Who consumes the most energy?

“If you can't measure it, you can't manage and save!”
Data center service and energy integrated management system
A power management software that collects performance information and power usage of x86 servers (Windows, Linux) in the data center
and visualizes and analyzes the resources and power usage of target equipment.

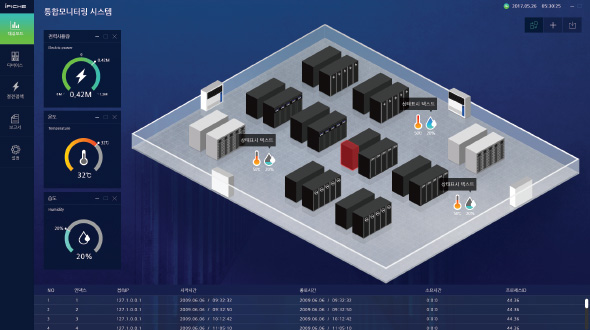
Intuitive user interface

Check your data center’s electricity usage and abnormalities at a glance
  • Data center power usage
  • Abnormalities by data center equipment

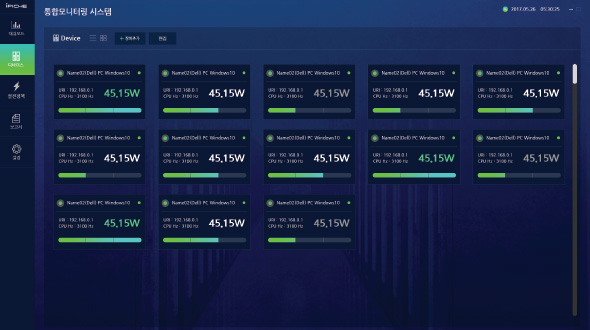
Flexible and diverse device interconnection

Support agent-based flexible equipment interconnection method Agent
  • Support agent-based flexible equipment interconnection

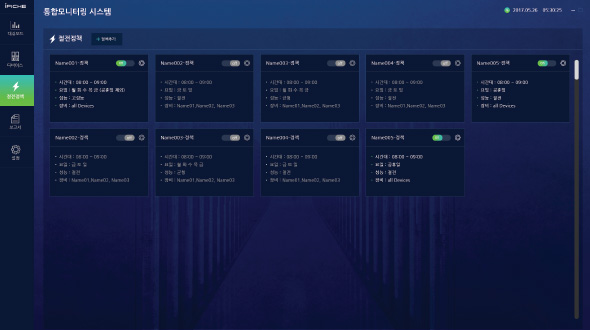
Energy management policy

Energy management policies for various options are applied.
  • Determine various power saving policies including time-based policy and day-based policy.

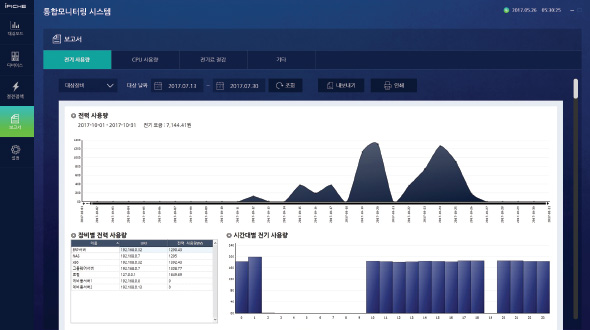
Report

Provide user-friendly reporting functions.

  • Provides energy consumption information from various perspectives
  • Operating reports of the provision system
Main functions
Function Content
Detection measurement

Information is collected by measuring power information, costs, and CO2 emissions of devices and systems connected to the network using an agent method.

  • Power usage visualization
  • System power visualization
  • Device detection using agent-based asset connector
  • Standard measurement of power consumption
  • CO2 emissions measurement
Modeling
policy settings

After analyzing the collected power information by date, time, etc., set a power consumption control policy.

  • Detailed power analysis
  • Power consumption / reduction
  • Energy costs
  • CO2 emissions from the device
  • Features of mass power consumption devices by various classifications
Policy implementation
control/savings

When a savings policy is implemented, the savings process begins by controlling the power consumption of the device or system using system management, etc.

  • Policy-based automatic control
  • Time-based
  • Based on day of week
  • Load Adaptive Computing
Inspection and verification

In the report menu, check power consumption, electricity bill, CO2 emissions, and daily reduction, and also compare usage and reduction, such as systems with high power consumption, division of efficient systems, or specific devices. As a result, conduct verification/analysis for additional savings, proceed with modeling policy settings, and continuously operate savings life cycle management.

  • Power consumption / cost report
  • Savings comparison energy report
  • Device / system report
  • Real-time reports, etc.
Main functions
Function Content
Detection measurement

Information is collected by measuring power information, costs, and CO2 emissions of devices and systems connected to the network using an agent method.

  • Power usage visualization
  • System power visualization
  • Device detection using agent-based asset connector
  • Standard measurement of power consumption
  • CO2 emissions measurement
Modeling
policy settings

After analyzing the collected power information by date, time, etc., set a power consumption control policy.

  • Detailed power analysis
  • Power consumption / reduction
  • Energy costs
  • CO2 emissions from the device
  • Features of mass power consumption devices by various classifications
Policy implementation
control / savings

When a savings policy is implemented, the savings process begins by controlling the power consumption of the device or system using system management, etc.

  • Policy-based automatic control
  • Time-based
  • Based on day of week
  • Load Adaptive Computing
Inspection and verification

In the report menu, check power consumption, electricity bill, CO2 emissions, and daily reduction, and also compare usage and reduction, such as systems with high power consumption, division of efficient systems, or specific devices. As a result, conduct verification/analysis for additional savings, proceed with modeling policy settings, and continuously operate savings life cycle management.

  • Power consumption / cost report
  • savings comparison energy report
  • device/system report
  • real-time reports, etc.

Integrated energy management solution that can be
quickly applied to various business environments

01
Energy visibility
  • Check individual equipment energy consumption/cost/savings in real time
  • Provide intuitive and visualized dashboard
  • Support various analysis tools such as simulation and modeling
02
Cost efficiency
  • Easy to build and operate, reducing management burden
  • No need for separate agents or expensive H/W equipment
  • Savings can be generated and measured immediately after applying the policy
03
Various operating environments
  • Support various IT operating environments such as office equipment / servers / networks / facilities
  • Support flexible energy management policies
04
Rapid implementation / application
  • Support rapid implementation without changing infrastructure/network configuration
  • Support various automated asset linking tools
KakaoTalkChat